Cubelets are the Inception of modeling tools. As you go deeper into your Cubelets experiences, you learn layer upon layer of new skills, taking your models from simple ideas to more abstract ones. At first, students model concepts like animal adaptations, poem structures, push and pull forces, or energy transformation. Then, as students gain a deeper understanding of Cubelets, they begin to draw models of how the data flows within and between Cubelets. This, in turn, opens doors for students to use Cubelets as a tool for modeling more abstract and complex behaviors like computer networks, the internet, and even Turing computers!
This is why we’ve written an entire Introduction to Computer Science mini-unit: to help you introduce concepts that take Cubelets from ‘fun building blocks’ to ‘modeling tool.’
At their youngest, or when Cubelets are most novel, learners will connect this tool to their background knowledge. For this reason, one of our recommended first challenges for Cubelets users is to build a Cubelets lighthouse. We mentioned this in our Tactile Coding blog post.
Then, students progress to designing robots that incorporate various animal adaptations such as nocturnal versus diurnal or object avoiding versus object seeking.
As robots become more complicated, however, Cubelets learners are bound to ask, “Why is this happening?” And if they don’t, we, as teachers, should!
This is where Data Flow Diagrams come into play. If you’ve read through the Introduction to Computer Science lesson plans, these will look very familiar. Creating Data Flow Diagrams can help students understand and explain the flow of data between Cubelets in a robot construction.
Much like students’ understanding of other science concepts, when starting simple, it seems everyone understands what is happening in their robots.
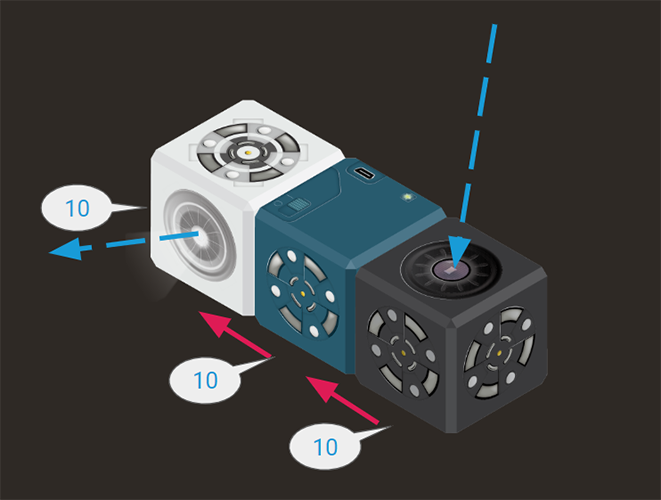
This robot, for instance, responds directly to brightness. The brighter the light, the brighter the flashlight.
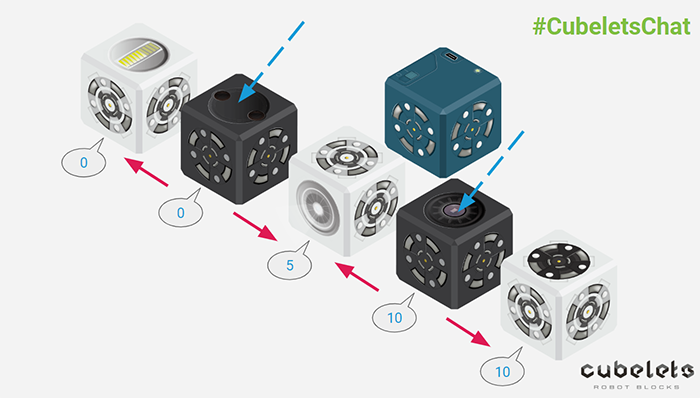
This robot, even, seems easy enough to explain. The Flashlight Cubelet in the middle averages out the values from each SENSE Cubelet, while the two Cubelets at the very end only listen to the SENSE Cubelet closest to them. This is because SENSE Cubelets do not pass along data from any other Cubelets. They only share the data value that comes from their sensing face, i.e. the data value they create.
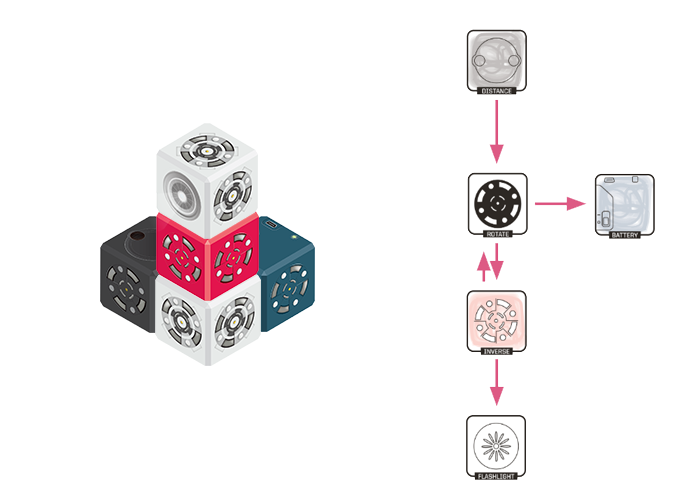
But how do we explain the results of this data flow diagram?
Diagramming Cubelets robots uncovers some behaviors that can change what we thought we knew about these tiny computers. It’s akin to a child learning about their shadow. First, they think their shadow is chasing them. Then, they realize their shadow is from them, and finally, they understand their shadow actually exists because they are blocking the light.
Frequently, teachers call the two initial shadow explanations “misconceptions,” but that term comes with some negative connotations. In fact, students are demonstrating some pretty sound logic when beginning to explain new phenomena. However, they rarely have gathered enough information to derive the most scientifically accurate conclusion. Instead of misconceptions, classical learning theorists refer to them as synthetic models that are logical and consistent with the data students have been exposed to so far.
It is our job as educators to understand the synthetic models our students already have in order to support their gradual discovery of the scientific explanations. This approach is referred to as the conceptual change model and it has one of the highest effect sizes in John Hattie’s 2016 research revision at 1.16.*
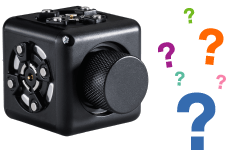
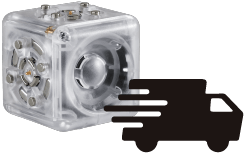
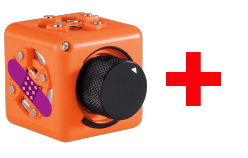
Working with Cubelets puts us, even as adult learners, in this learning flow. At first we only understand our synthetic models about basic robots using SENSE, THINK, and ACT Cubelets; then we use our observations to justify more complicated robot behavior. But just when we think we understand all there is to know about Cubelets, we check our work using the Cubelets App or the Bar Graph Cubelet and discover some seriously strange results.
I won’t lie, sometimes I’ve discovered something so mind-bogglingly different than I expected that I went straight to our software development team with my puzzle, unable to confidently reason my way through it alone. (I’ll post an upcoming #CubeletsChat to show you some of these crazy senseless robots, blinking robots, and other unique data flow diagrams.)
So how do we know what our students actually understand versus what they parrot back to us? Well, we need to see their thinking.
This means asking them to draw, write, label, and explain what is happening in novel or repeated situations. This means we need to stop our lesson at least ten minutes before class ends to give students time to silently and independently record what they think they know about Cubelets (or any other content for that matter). Teaching with data flow diagrams offers a quick, yet comprehensive, view into students’ understanding of their Cubelets constructions.
If you haven’t heard about Data Flow Diagramming but are familiar with the Cubelets basics, check out our Cubelets 102 free online workshop. It’ll take you roughly 45 minutes to complete and you’ll get a certificate of completion at the end to use for continuing education credit.
*John Hattie studied the effect of textbooks that use a conceptual change approach which is slightly different than using conceptual change as a classroom practice, but it also supports the overlap in his findings between inquiry-model classrooms and time for direct instruction.
Enjoyed this blog post? Sign up for the #CubeletsChat newsletter to receive the next blog post straight to your inbox. Plus join the discussion on twitter using the #CubeletsChat hashtag!
